[Please Note: The 2020-2021 competition has come to a close and the judges have made their decisions. The winners of this first NISS contest can be found in the news coverage for this first competition.
Information about the Spring 2022 competition can be found following the link below:
The Spring 2022 NISS SAID in Graphics Competition is now Open!!
Do you love to make insightful discoveries in education data and cutting-edge visualizations to display them?
NISS has a COMPETITION FOR YOU!
Great examples of data visualization and interactive graphics are popping up everywhere! See the examples collected at these sites:
- The 34 Best Interactive Data Visualizations from the New York Times, or
- Demographic Comparisons on Git Hub
(Please note: These sites above are not associated with NISS).
The National Institute of Statistical Science is sponsoring a student data visualization contest - for creating examples of how interactive data visualization techniques can be applied to enhance the data presentations in several public reports about education. Simply put, NISS is looking for Statistically Accurate Interactive Display in Graphics -- SAID in Graphics!
Choose one of the reports and create a graphical presentation that grabs the viewer’s attention – even before reading the report - and then entices the viewer to interact to follow up for more information. We provide data sets for each of these reports (with some additional data). Your mission is to design an innovative visualization that attracts the reader and expands the information presented in a meaningful way.
Register by (Date Extended) December 28th to get your data set and get started!
The Reports
Check these out online using the links below:
 Characteristics of Public Elementary and Secondary School Principals in the United States
First Look (NCES 2017-070) https://nces.ed.gov/pubs2017/2017070.pdf
Principals' Characteristics: Data Information
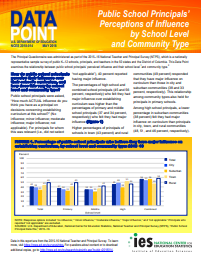 Principals' Perceptions
Data Point (NCES 2018-014) https://nces.ed.gov/pubs2018/2018014.pdf
Principals' Perceptions: Data Information
E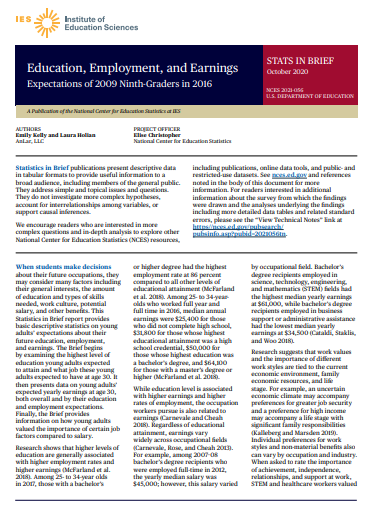 ducation, Employment, and Earnings: Expectations of 2009 Ninth-Graders in 2016
Stats in Brief (NCES 2021-056) https://nces.ed.gov/pubs2021/2021056.pdf or https://files.eric.ed.gov/fulltext/ED608226.pdf
Education, Employment, and Earnings: Data Information
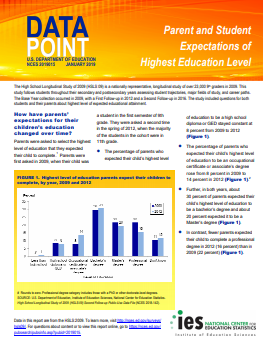 Parent and Student Expectations of Highest Education Level
Data Point (NCES 2019-015) https://nces.ed.gov/pubs2019/2019015.pdf
Parent and Student Expectations: Data Information
The Data
De-identified extracts and/or synthetic data sets are made available, corresponding to each report. The data sets can be accessed after you have registered. Only one report should be selected for each entry (one entry per individual, up to two entries per team). Participants may select as many or as few of the data elements in the set as needed to go beyond what is in a single table or figure in the motivating report.
Eligibility
There are two competitions…
1. The cross-disciplinary team competition is open to groups of two to six students enrolled in two or three different departments, including at least one education or social science department such as Education, Measurement, Psychology, or Sociology, and at least one data science department such as Statistics, Data Science, Mathematics or Computer Science. One Team Co-Leader must be a graduate student in an education/social science program and the other Team Co-Leader must be a graduate student in a data science program. Undergraduates may participate as team members. A cross-disciplinary team may submit up to two graphics for the same or different reports.
2. The individual competition is open to anyone enrolled as a graduate student in a US or Canadian education or social science program such as Education, Measurement, Psychology, or Sociology, or a data science program such as Computer Science, Data Science, Mathematics, or Statistics. An individual may submit only one graphic.
Please Note:
- Each student can participate only once, either as a member of one team or as an individual.
- Students must be enrolled in a data science or an education or social science program in the US or Canada on or after September 1, 2020.
- A student is ineligible to participate if currently employed or has an agreement for future employment – either paid or unpaid (including internships) – with a software producer that creates graphics software whether proprietary or open source. (If you have questions on your particular internship or employment, please contact bhabing@niss.org.)
The Requirements
The goal is to demonstrate how interactive visualization can be used to prod readers of various backgrounds to investigate substantive educational questions more deeply.
- The innovative graphic must use a provided data set to investigate the information in one or more of the tables in its accompanying report. Participants are not limited to using only variables that were accounted for in the report’s original tables or figures. The questions examined must be of educational interest, fitting with, or expanding on, the goals of the report.
- The interactive graphic must be designed to communicate with the public by grabbing the readers’ attention, enticing them to interact with the data, and leading them to more deeply investigate the substantive questions addressed by the data. The target audience of the graphics include parents, educators, policy makers, and researchers.
- The finished product is intended only to be an example and not an entire graphical suite for examining the data set, so a single interactive graphic could be sufficient. The example interactive graphic must provide a visualization of uncertainty. It must expand the information in the original graphic., The graphic must be accompanied by a brief statement or a key to guide its interpretation. The graphic should avoid being standard, static, or boring.
- Registration at is due by midnight on Monday, December 28th using the on-line registration form (link below). Your mode of entry (team or individual) and report selection (data set) can change after that by notifying us.
- Data will be released to the primary Team Co-Leader following submission of signed confidentiality agreements by all team members.
- The submitted materials must include: color images of the graphic in a .pdf file to print at letter size, the explanatory text in a .pdf file to print at letter size, and the code used to generate the graphic with any needed instructions. You may also include a url (such as to a Shiny) and/or an .mp4 video of you (or your team) demonstrating the graphic.
- The graphic must be accompanied by a bulleted explanatory text that describes what substantive findings the graphic reveals. The style should be similar to that of the motivating report. Department of Education policy requires that these reports avoid inferring causality in their findings.
- A team may submit no more than 2 graphics. An individual may submit only 1 graphic.
- All materials submitted become the property of NISS to use your images as examples for panel and internal discussions.
- All materials must be uploaded to our Drop Box by 8:00AM EST on Wednesday, January 6th.
Judging
Judging will be done by NISS staff and experts; their decisions will be final. Judging will be based on:
- Graphic as it would initially appear (static) on website to attract viewer prior to interaction.
- Substantive relevance of graphic in expanding information beyond originally published graphic.
- Statistical accuracy conveyed and completeness of graphic, including representation of uncertainty
- Feasibility of implementation and usefulness as template or prototype for other reports
The Prizes
The prize for the winning team is a total of $1500, shared equally across the two or three co-leaders' departments. The prize for the individual competition is $250 for their department. There is also a “Simply Glorious” prize of $250 that will be awarded at the discretion of the judges. It will be awarded for one graphic from either team or individials submission that is more aspirational than might be easily used as a template or generalized for wider implementation. So - think outside of the box!
At NISS discretion, additional prizes may be awarded following judging. All prizes are awarded to the winners' departments.
Winners will also be invited to be part of a NISS presentation on statistical graphics for researchers in other disciplines!
Software
Software selected must be available either as open source or as a proprietary package available for purchase.
Need a kickstart on a few of the software choices? Here’s one place to start for R (https://www.r-graph-gallery.com/interactive-charts.html) and one for tableau (https://www.datacamp.com/community/tutorials/data-visualisation-tableau). (Please note: These sites are not associated with NISS). You might also think about using SAS, ArcGIS, Data-Driven Documents JavaScript Library - D3, or Python. But, you are not limited to these. It depends on what you have access to and what makes sense for what you would like to do. See the FAQ page for additional ideas.
Questions?
Check out our FAQ Page and please direct all questions to Brian Habing (BHabing@niss.org). He is also available for video conference consultations.
Event Type
- NISS Hosted
- NISS Sponsored