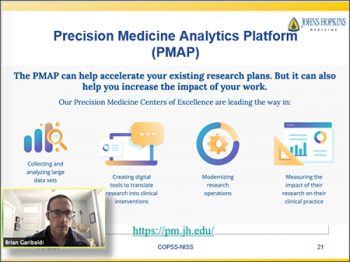

Moderator Karen Bandeen-Roche, (Johns Hopkins University) opened the session by introducing both of the speakers. The first speaker was Brian Garibaldi, (Johns Hopkins) Associate Professor of Medicine in the Division of Pulmonary Critical Care Medicine, and Director of the Johns Hopkins Biocontainment Unit. He also directs the Johns Hopkins Precision Medicine Center of Excellence for COVID-19. Karen also pointed out that Brian is also an actively practicing clinician who has been out on the front lines providing COVID care more than once appearing in weekly zoom meetings in full PPE having come directly from the ICU! The second speaker, Scott Zeger, (Johns Hopkins) Karen introduced not only as one of the world's eminent biostatisticians but also one of the most highly cited mathematical scientists in the world! Long proceeding the COVID pandemic Scott became passionate about the need to improve healthcare value in the United States. Scott subsequently led the founding of the Precision Medicine Initiative at Johns Hopkins and continues to serve as Co-Director. (see Event page)
“I think you're in for an amazing, inspiring story for what is possible when data science, health science and medicine partner closely together.”
Karen Bandeen-Roche, (Johns Hopkins University)
This is a story about a dire need to learn more about COVID-19, finding ways to collect data which will then allow for analyses in new ways.
Brian Garibaldi (Johns Hopkins) began by describing the development of the bio-containment unit at Johns Hopkins which is one of 10 similar regional treatment centers around the United States. Initially set up to take care of Ebola and other diseases, these units were called into use during the COVID-19 pandemic. He moved into a detailed description of patients that presented with COVID-related symptoms and the questions surrounding how best to treat them. At the same time, prompted by a research group put together by the Vice-Dean of Research at Johns Hopkins, Anthony Rosen, questions about the disease were being routinely asked which then led to the development of the JH-CROWN registry that collects COVID-19 patient data from a variety of sources allowing for novel statistical analyses that previously were not possible.
While Brian looked at addressing COVID-19 symptoms as a clinician, Scott Zeger, (Johns Hopkins), approached these same questions, “What is the current disease state? What is the likely trajectory? Which treatment should be used?” as a statistician. Scott described the statistical challenges involved including the wrangling of huge amounts of data from a variety of sources, the fact that there was no evidence base to work from and that what is collected is mostly observational data coming from an iterative process of trying different approaches to find the most appropriate. The predictors were both numerous and dynamic while at the same time significant risk to patients was involved!
Scott addressed a series of research questions, presenting the challenges that were involved and the specific and unique methods of analyses that were used to begin to tackle the unique challenges that each question presented. The research questions that Scott provided detailed descriptions for included:
- “What is my risk of having severe disease given my condition on time 0 – start of hospitalization?”,
- “What is my risk of having severe disease given my current condition on time t?”,
- “Given my current state, what are my future risks of discharge, intubation or death; what are my expected biomarker trajectories?”, and
- “What treatment is best for me now given my outcomes to date; should I be intubated today?”
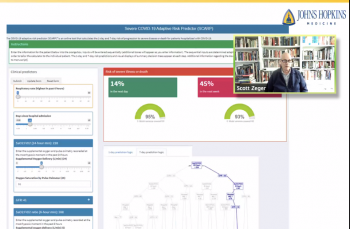
The data description, models and methodologies used led researchers to create data visualizations to help support the variety of decisions that clinicians need to be make. The recording of this session and the slides that were used by the speakers are required in order to absorb all the statistical details involved in the approaches undertaken and solutions that were developed!
“The clinicians keep reminding us, and I keep reminding myself, that absent these kinds of tools they would just they just have to wing it. It's complicated now because they have lots of information, lots of data. But now we can use the data to help with making predictions, or use models to do “what if?” scenarios and to help them interpret the data.”
Scott Zeger, (Johns Hopkins)
The webinar finished up by responding to questions from attendees and Karen was certainly busy passing these on for discussion by both Brian and Scott to address. These included questions such as “How did you decide how best to present risk predictions (for frontline clinicians) and cohort results (for data scientists) as we know knowledge translation is so key to bringing precision medicine to the frontlines?”, Do you have data visualization/information design experts on your team or do your statisticians help to determine how the data should be visualized?”, “How do you handle the virus mutations in your models?” and “How do you determine whether data updates may change predictions and when to implement the updates?”
Recording of the Session
Slides Used by the Speakers
Brian Garibaldi and Scott Zeger, (Johns Hopkins)
"Flying the Plane While Improving It – Learning from COVID Patient Data in Close to Real Time“
About this Webinar Series
The COPSS-NISS COVID-19 Data Science webinar series is co-organized by the Committee of the Presidents of Statistical Societies (COPSS) and its five charter member societies (ASA, ENAR, IMS, SSC, and WNAR), as well as NISS. This bi-weekly seminar features the latest research that is positioned on the cusp of new understanding and analysis of COVID-19 pandemic data, and promotes data-driven research and decision making to combat COVID-19. Find out more about this series and view all the previous sessions on the Webinar Series page.
